Skip Navigation

The Human Element of Investing

Why investing in what you know can be a big mistake

We often hear that you should invest in what you know – Warren Buffet is a high-profile exponent of this advice. However, over-investing in sectors we’re comfortable with can be very risky to our financial health. The most secure and best-performing portfolios tend to be well diversified. If you only invest in what you know, you may not have sufficient diversification and could be exposed to potential high losses.

Also, it can be far more difficult to make unbiased investment decisions on your own industry or companies within it. It can be difficult to decide on which companies might make for the best investment when the company you work for is one of them.

Furthermore, when investors think about diversification, they typically only consider assets within their accounts and not their own personal human capital. Human capital is our monetary value to ourselves — effectively our job and the income it brings with it. For maximum diversification, we believe investors need to consider the money and the industry it comes from when building our portfolio.

How investing in what you know can lead to financial disaster

Let’s take an extreme example to explain what I mean. Jean works in the oil and gas industry. She has shares in the company she works for and has a heavy bias towards oil and gas in her portfolio. If the industry experiences a downturn, her company goes under, and she loses her job, Jean will be horribly financially exposed. Her human capital will be wiped out, her company shares will drop substantially, and her portfolio could lose much of its value.

Taking this further, it’s even wiser to consider investing in industries that have the least correlation to the sector you work in. If your company and/or industry collapses, your investments should be better protected.

How to diversity your portfolio based on your profession

Which industries should you consider investing in that have the least correlation with your own? Below we outline five top sectors in Canada. Click on the one that best represents your sector to discover suggestions for other sectors and asset classes that you could invest in that are least correlated to your own, so that you could consider how to develop a more diversified and better risk-protected portfolio.

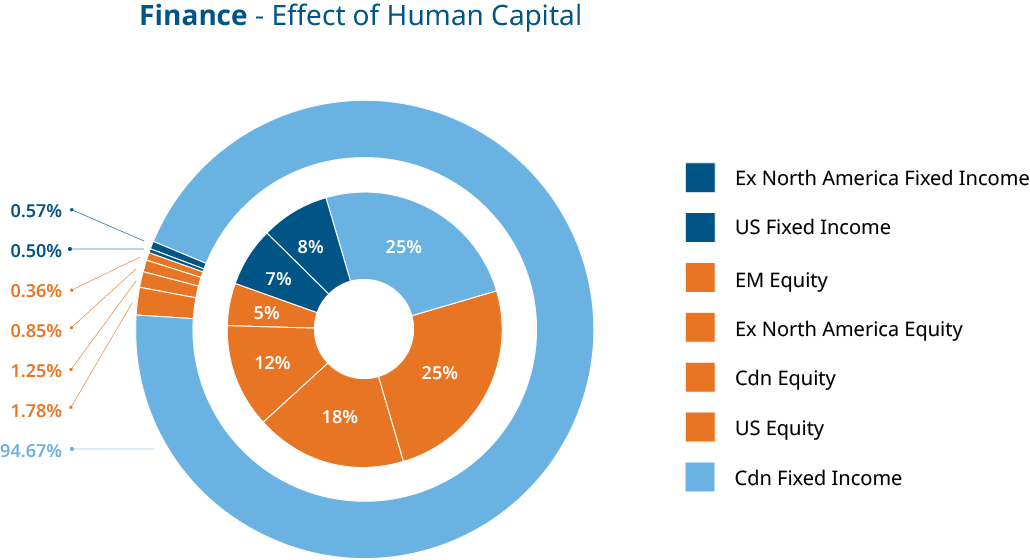
The inner circle of each chart represents a typical asset allocation of investments, as a comparison. The outer circle represents the asset allocation once income within your profession is taken into consideration*. The historical correlation for each sector is shown in brackets.
Sector 1: Energy (the production and supply of fuel and electricity)

Sector 2: Finance (financial institutions such as banks, credit unions, insurance, investments, fintech and cryptocurrencies)

Sector 3: Technology (software and hardware, IT gadgets, online streaming, etc.)

Sector 4: Materials (companies that produce the raw materials to produce goods, such as paper, metals, chemicals and plastics)

Sector 5: Teacher (various levels of educational positions)


The constants for these calculations are that the investor is 30 years old, will work for a further 30 years, earns a typical income for that industry and has a present value calculation that uses a discount rate of 5% (a discount rate reflects the risk of future earnings).

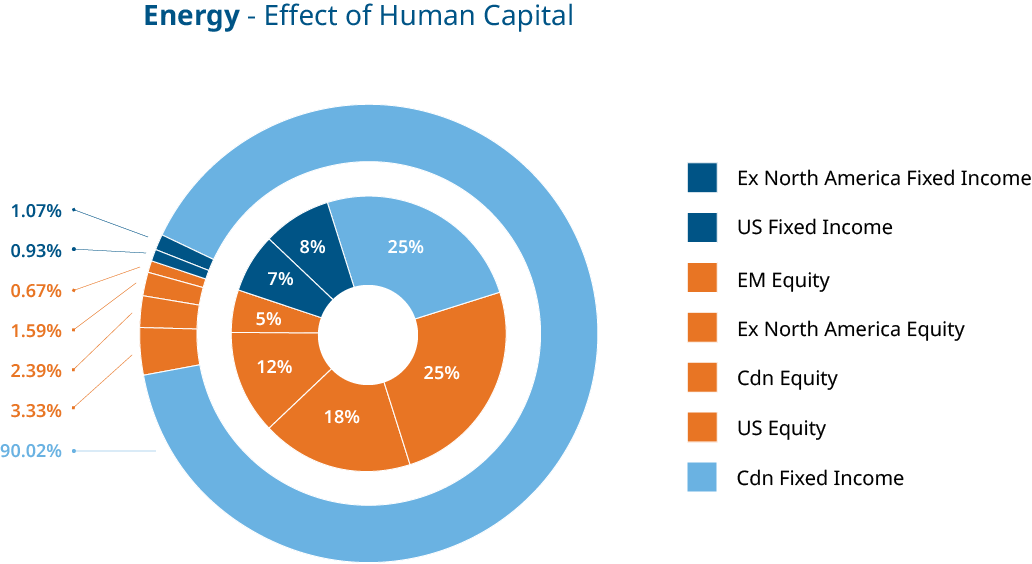
Sector 1: Energy

The inner circle represents an asset allocation of investments: Canadian fixed income makes up 25%, US and ex-North America fixed income makes up 15% in total, while the remaining 60% is comprised of US, Canadian, ex-North America and emerging market equities.

The outer circle represents the asset allocation once the person’s income within the energy industry is taken into consideration, as a kind of bond.

The outer circle is now comprised of 90.02% Canadian fixed income, with 2% in US and ex-North America fixed income and 7.98% in US, Canadian, ex-North America and emerging markets equities. 

1567132-img-1-en

The least correlated industries to invest in that could provide greater diversification:

  1. Telecommunications (0.31)
  2. Consumer staples (0.34)
  3. Health care (0.35)

Sector 2: Finance

The inner circle represents an asset allocation of investments: Canadian fixed income makes up 25%, US and ex-North America fixed income makes up 15% in total, while the remaining 60% is comprised of US, Canadian, ex-North America and emerging market equities.

The outer circle represents the asset allocation once the person’s income within the finance industry is taken into consideration, as a kind of bond.

The outer circle is now comprised of 94.67% Canadian fixed income, with just over 1% in US and ex-North America fixed income and 4.27% in US, Canadian, ex-North America and emerging markets equities.  

1567132-img-5-en

The least correlated industries to invest in that could provide greater diversification:

  1. Utilities (0.33)
  2. Telecommunications (0.42)
  3. Energy (0.49)

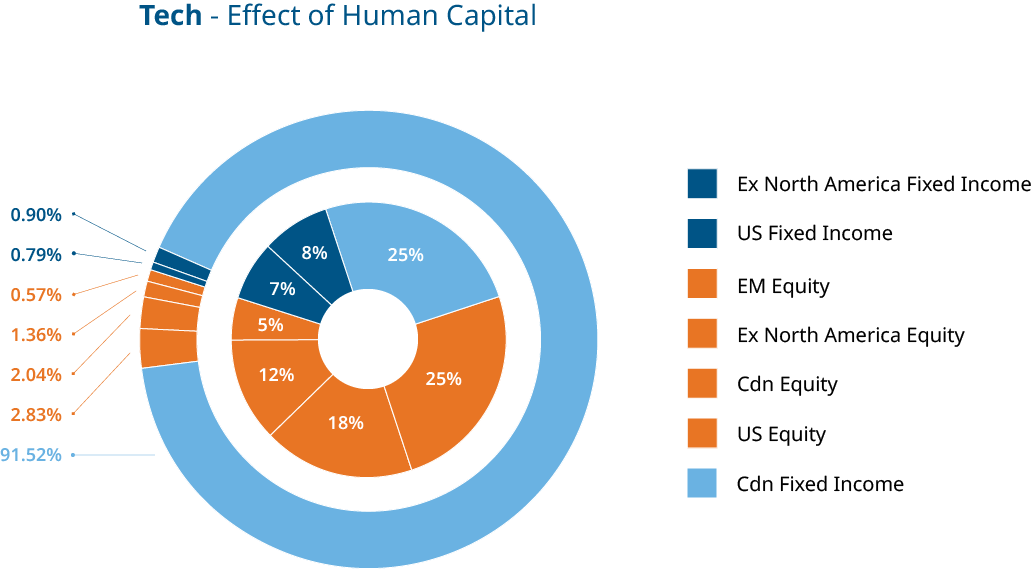
Sector 3: Technology

The inner circle represents an asset allocation of investments: Canadian fixed income makes up 25%, US and ex-North America fixed income makes up 15% in total, while the remaining 60% is comprised of US, Canadian, ex-North America and emerging market equities.

The outer circle represents the asset allocation once the person’s income within the technology industry is taken into consideration, as a kind of bond.

The outer circle is now comprised of 91.52% Canadian fixed income, with 1.69% in US and ex-North America fixed income and 6.8% in US, Canadian, ex-North America and emerging markets equities. 

1567132-img-2-en

The least correlated industries to invest in that could provide greater diversification:

  1. Utilities (0.16)
  2. Consumer staples (0.27)
  3. Energy (0.37)

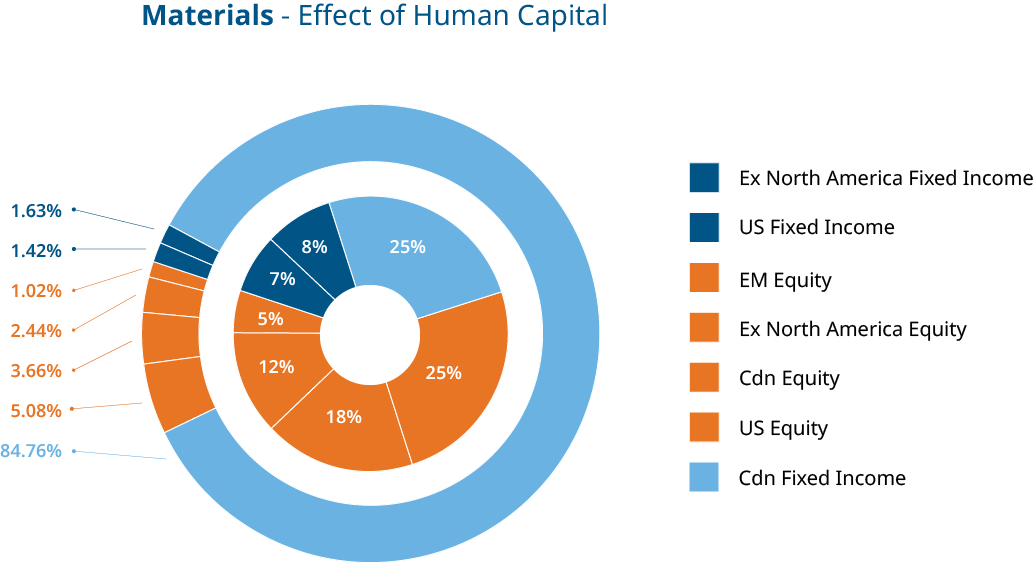
Sector 4: Materials

The inner circle represents an asset allocation of investments: Canadian fixed income makes up 25%, US and ex-North America fixed income makes up 15% in total, while the remaining 60% is comprised of US, Canadian, ex-North America and emerging market equities.

The outer circle represents the asset allocation once the person’s income within the materials industry is taken into consideration, as a kind of bond.

The outer circle is now comprised of 84.76 Canadian fixed income, with 3.05% in US and ex-North America fixed income and just over 12% in US, Canadian, ex-North America and emerging markets equities. 

1567132-img-3-en

The least correlated industries to invest in that could provide greater diversification:

  1. Utilities (0.30)
  2. Telecom (0.39)
  3. Health care (0.43)

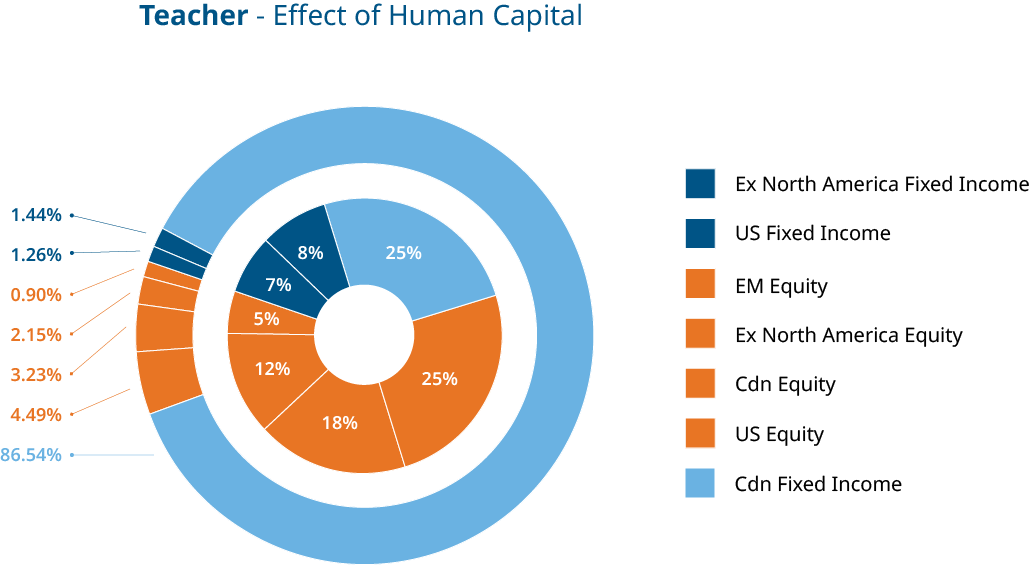
Sector 5: Teacher

The inner circle represents an asset allocation of investments: Canadian fixed income makes up 25%, US and ex-North America fixed income makes up 15% in total, while the remaining 60% is comprised of US, Canadian, ex-North America and emerging market equities.

The outer circle represents the asset allocation once the person’s income within the teaching profession is taken into consideration, as a kind of bond.

The outer circle is now comprised of 86.54% Canadian fixed income, with 2.7% in US and ex-North America fixed income and 10.77% in US, Canadian, ex-North America and emerging markets equities. 

1567132-img-4-en

The least correlated industries to invest in that could provide greater diversification:

  1. Financial equities (-.16)
  2. Energy equities (-.12)
  3. Health care equities (-.07)

Find out more about investing in less correlated sectors by talking to your financial advisor.

STAY TUNED for our follow-up blog on human capital, “How diversified is your relationship?”, coming soon.

Innovative ETFs

ETF Insights Blog